Insights
The Insights page shows how your alerts behave over time: alert volume, peak hours, restore and response times, and the alerts that keep coming back.
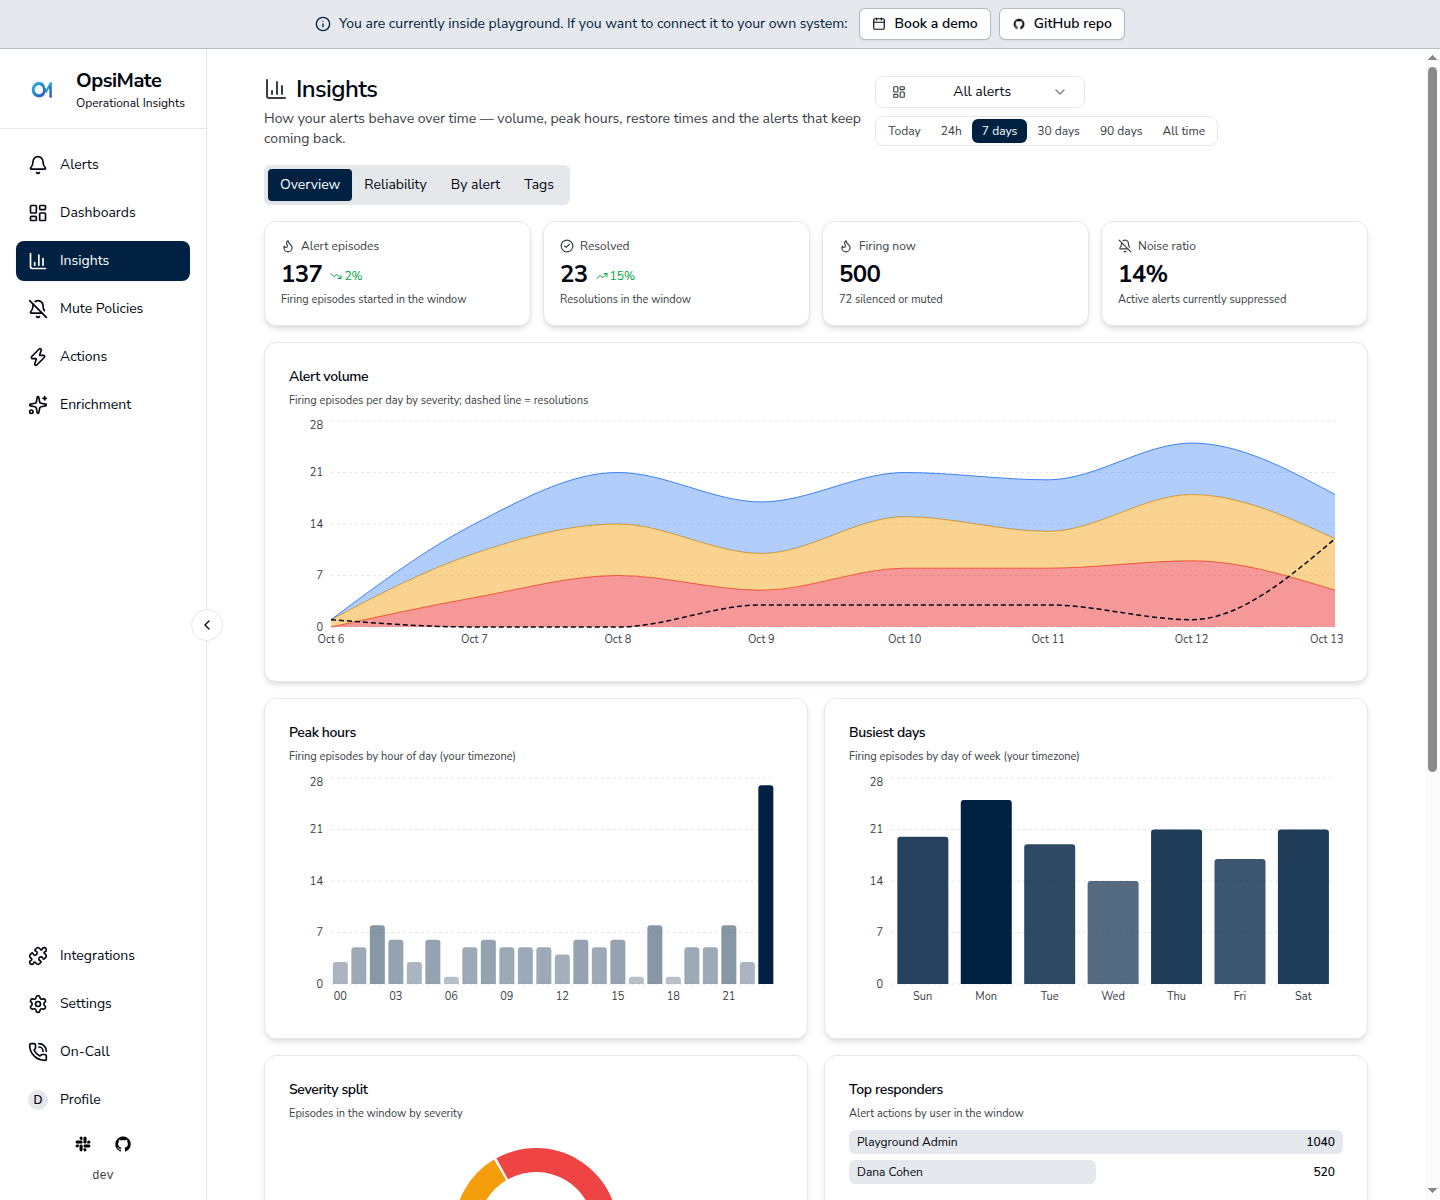
Opening Insights
Click Insights (the bar-chart icon) in the left sidebar. The page lives at /insights.
Time Range
Pick the window at the top right:
- Today: from the start of your current day until now
- 24h
- 7 days (the default)
- 30 days
- 90 days
- All time
Windows of 48 hours or less are bucketed by hour, and longer ones by day. Days and hours follow your browser's time zone.
Dashboard Scope
The dashboard picker next to the time range (All alerts by default) limits every number on the page to the alerts that match one of your saved dashboards, using that dashboard's filters and search.
Overview Tab
- Alert episodes: firing episodes that started in the window. An alert that fires twice counts twice, so this measures load, not how many distinct alerts you have.
- Resolved: resolutions in the window.
- Both cards show the change vs the previous period of the same length, for example the 7 days before the current 7 days. There is no comparison on All time.
- Firing now: alerts firing right now, with how many of them are silenced or muted.
- Noise ratio: the share of active alerts that are silenced or muted, meaning suppressed rather than fixed.
- Alert volume: firing episodes over time, stacked by severity. The dashed line shows resolutions.
- Peak hours and Busiest days: firing episodes by hour of day and by day of week, in your time zone.
- Severity split: episodes in the window by severity.
- Top responders: alert actions by user in the window.
- Top alerts: the most frequent alert names in the window.
- Common tags: the most frequent tag values across alerting alerts.
Reliability Tab
- MTTR (mean time to restore): firing → resolved, for episodes resolved in the window. Shown as mean, median and p90, with the change vs the previous period.
- MTTA (mean time to acknowledge): time from firing to the first human action, meaning own, silence, comment, run an action, or resolve.
- MTBF (mean time between failures): the mean gap between consecutive firing episodes of the same alert.
- Re-fire rate: the share of resolutions followed by the same alert firing again within 24 hours, meaning the fix didn't hold.
- Ack coverage: the share of episodes that got any human action while firing.
- Episodes / day: the average number of episodes per day in the window.
- Response trend: the MTTR and MTTA trend chart over the window.
By Alert Tab
One row per alert name, with the columns Alert name, Episodes, MTTR, MTBF, Re-fire and Last seen. The name cell also shows the alert's worst severity and a firing badge when it is firing now.
Tags Tab
Pick a tag key (for example env or team) to see each of its values:
- Distinct values, Tagged episodes, Tag coverage and Firing now cards for the key
- A table with Value (with its worst-severity badge), Episodes, MTTR and Firing per value
- A volume chart of episodes by value
- Per-value MTTR and MTTA trends
API
The page is built on one endpoint:
GET /api/v1/alerts/analytics
All query parameters are optional:
| Parameter | Description |
|---|---|
from | Start of the window, as an ISO date-time. Leave it out for all time. |
to | End of the window, as an ISO date-time. |
tz | IANA time zone used for day and hour buckets, for example Europe/Berlin. |
filters, search | Limit the analytics to matching alerts. Same format as the alerts list endpoint. |
tagKey | A tag key to research. Adds the tagInsights section to the response. |
A from later than to returns HTTP 400.
Authenticate like the other API endpoints, with your login token or the instance API token.
Example:
curl -H "X-API-Token: <your-api-token>" \
  "https://your-opsimate-instance.com/api/v1/alerts/analytics?from=2026-10-06T00:00:00Z&to=2026-10-13T00:00:00Z&tz=UTC&tagKey=env"