Alert Management
The Alerts page is the working queue for everything OpsiMate receives: one table of alerts from all your integrations, with the filters, grouping and bulk actions you need to get through it.
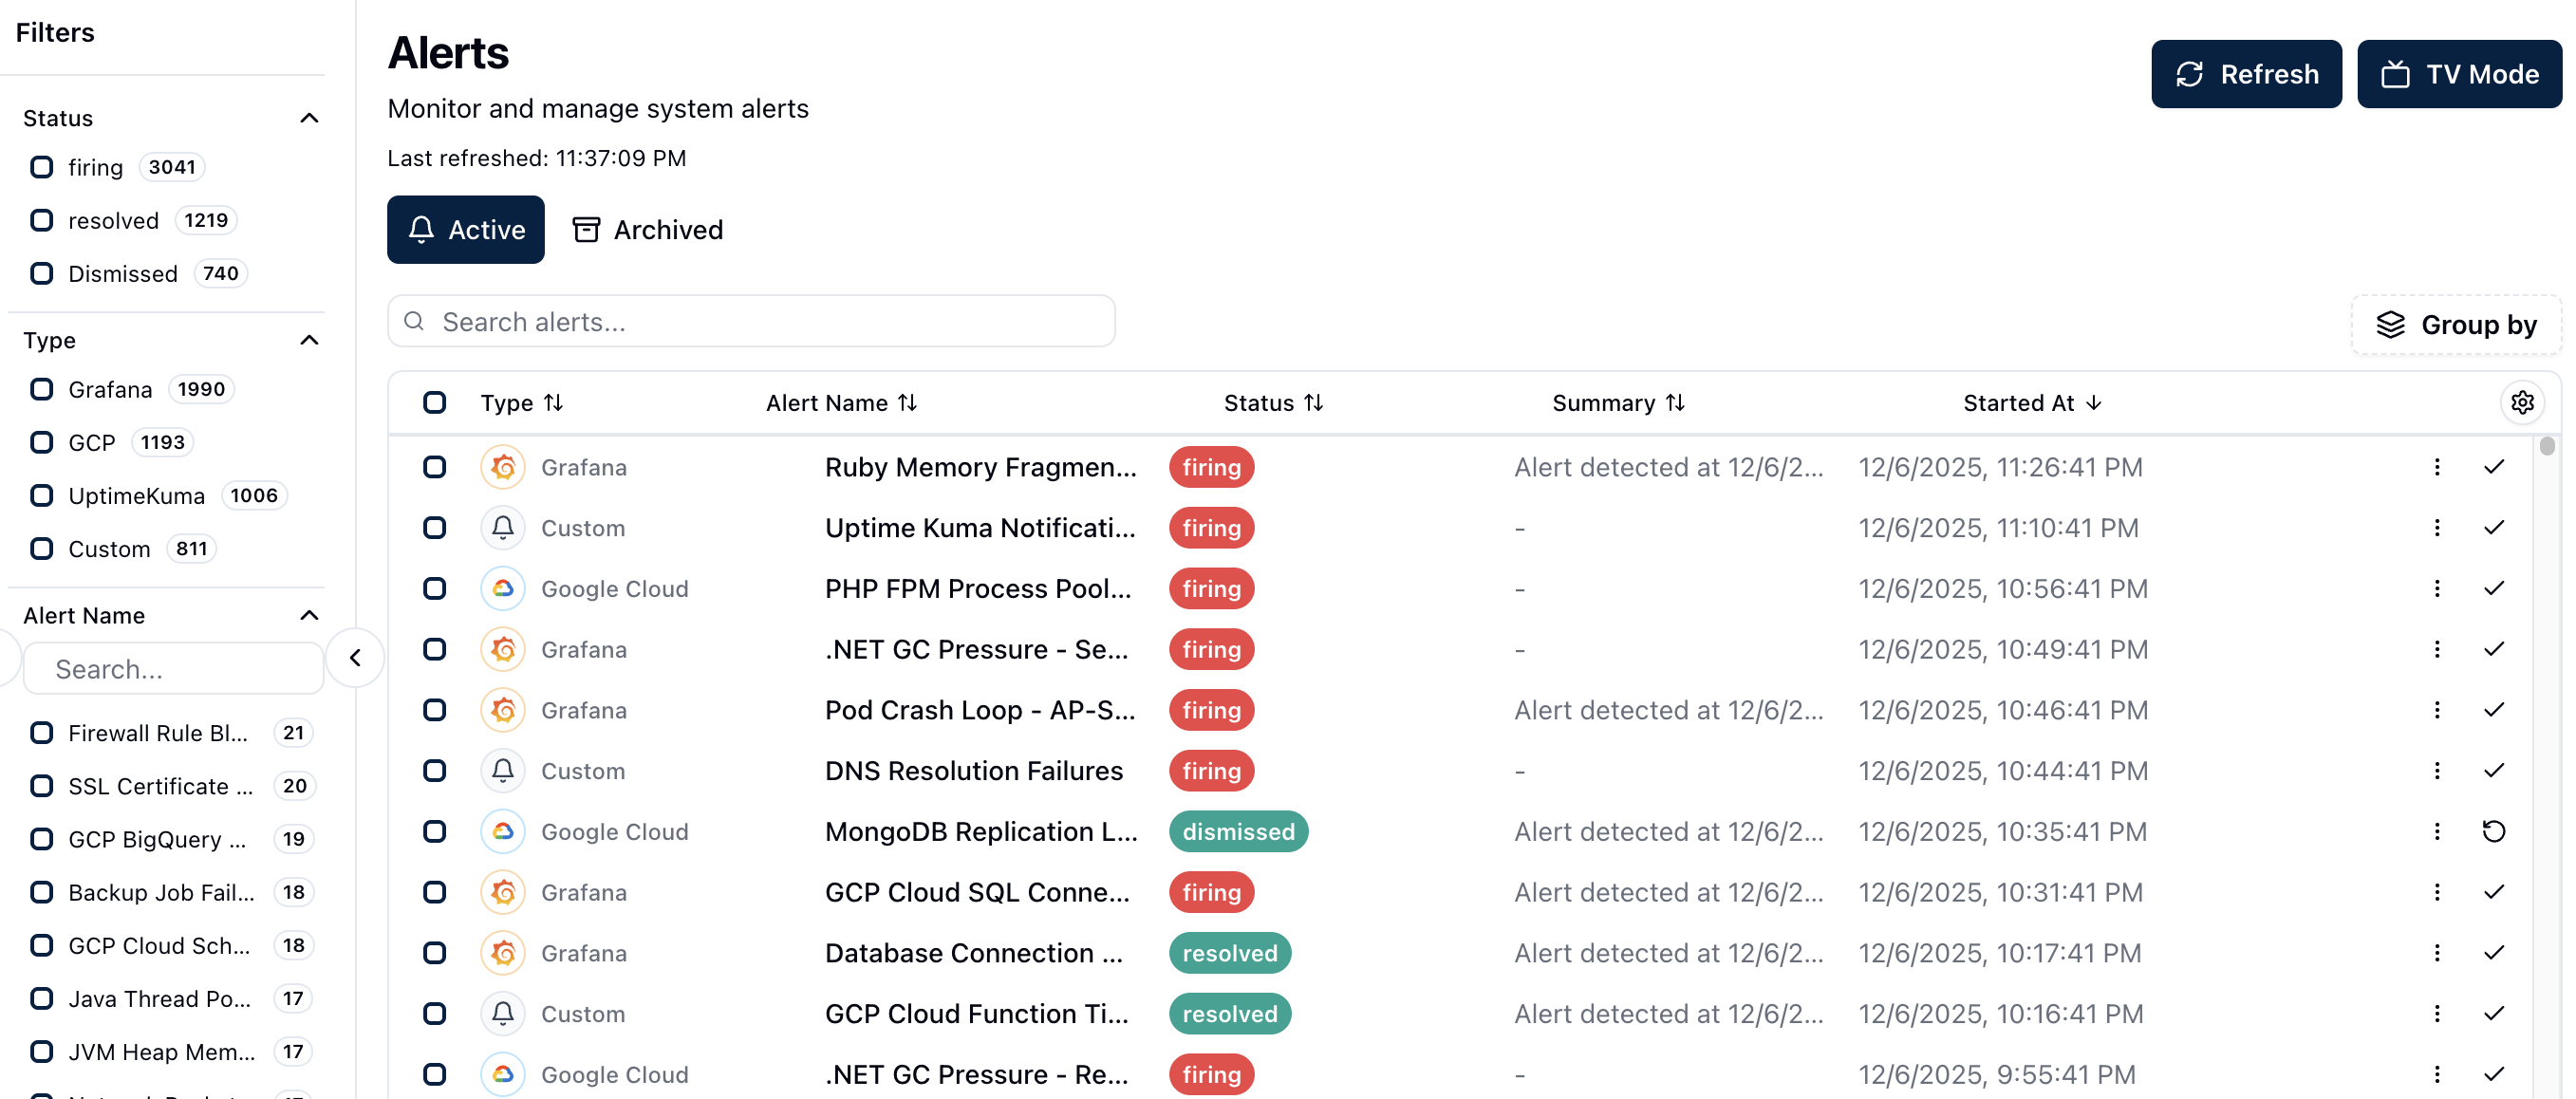
OpsiMate alerts dashboard showing real-time notifications and alert management
The three views
At the top of the page you pick what the table shows, and each option carries a count:
- Active — alerts that are still open. This is the working view, and the only one with row checkboxes.
- Resolved — alerts that have been closed out. See Archived Alerts.
- All — both at once.
An alert's own status is shown in its row: Firing, Silenced until …, or Muted.
Finding alerts
Search. The search box matches alert name, status, summary, tags, the latest comment, and the integration the alert came from. It runs on the server as you type.
AI search. When an admin has enabled AI, a sparkle button appears next to the search box. Switch to it, describe what you want in plain language ("critical CPU alerts from the last two hours owned by nobody"), and press Apply — OpsiMate turns that into real filters, search text and a time range, and replaces your current view with them. The button only appears when AI is enabled with an API key and model ID configured; otherwise use search and filters. Filters applied confirms what happened.
Filter panel. Filters opens a panel with a section per field: Status, Severity, Type, Alert Name, Owner, and one section for each tag key. Each value shows how many alerts match it. Pick values to include them (Filter) or exclude them (Filter out, shown as ≠ on the active chip), load more values with Load 5 more..., and clear everything with Reset all filters.
Time filter. The time button (default All time) narrows the list to a window: a Quick preset from "Last 1 minute" up to "Last 7 days", or a Custom From/To range.
The filters you set are also what a saved dashboard stores, and what bulk select all matching acts on.
Grouping
Group by organises the table into expandable groups. You group by the columns shown in the table — status, severity, source integration, alert name, owner, or any tag column — not by arbitrary fields inside the alert payload. Add a column to the table first if it isn't there.
- Choose several columns to nest groups inside groups; drag them to change which one splits first.
- Expand or collapse a single group with its chevron, or use Expand all / Collapse all.
- The grouping is part of your dashboard state, so it is remembered — and saved with a dashboard when you save one.
Unread alerts
Alerts nobody has opened yet are drawn in bold. Opening an alert marks it as read, and it goes back to normal weight. Read state is shared, not per user: once anyone opens an alert, it is read for everyone. When the source sends the alert again, it becomes unread and bold again. There is no bulk mark-as-read; reading is what happens when you look.
The details panel
Click a row to open the panel on the right. It has two tabs, Details and Comments, and the details tab shows, in order (apart from the identity block and Labels, a section only appears when it has something to show):
| Section | What's in it |
|---|---|
| Identity block | The source integration's avatar, the alert name and the Owner picker, with icon-only badges for severity, fix, status and enrichment (hover for the label). |
| Summary | The alert's own summary text. |
| Team | The team behind the alert and who is on call right now, with a phone link. If no on-call schedule matches, it says so. |
| Root cause | A root-cause analysis pushed for this alert by an external tool through the API, labelled "via API". |
| Latest comment | The most recent note, with a jump to the full thread. |
| History | The timeline of everything that happened to this alert. |
| Labels | The labels OpsiMate received with the alert. |
| Links | The link to the alert in the source monitoring tool, and the runbook link if one is set. |
Custom actions defined for the alert appear here too. Expand all sections / Collapse all sections controls the whole panel at once, and Silence, Unsilence and Resolve stay pinned in the footer.
Ownership
Assign an owner from the Owner picker in the details panel or from the Owner column, and filter by owner in the panel. Silencing or resolving an alert makes you its owner automatically, so the person who acted is the person accountable.
Ownership changes are recorded in the alert's history. OpsiMate has no escalation rules and no handover workflow — an owner is an assignment, not a schedule.
Comments
The Comments tab is a thread per alert: add a comment, and edit or delete your own. Silence and Resolve both accept an optional note (Silence comment, Resolve comment), which is saved as a comment on the alert — which is why a reason for closing something shows up in the thread and in the history.
History
History is the timeline of the alert: automatic status changes and everything people did — owner assigned or unassigned, silenced and unsilenced, resolved and unresolved, actions run, comments added. The graph is filterable by All, Status and Activity, and Export history downloads it as Export as CSV or Export as JSON.
Bulk actions
On the Active view, tick rows to select them. Once every visible row is selected and more alerts match your filters, the bar offers Select all N matching, which extends the selection to every alert that matches the current filters — not just the page you can see.
The selection bar then offers: Assign Owner, Silence all, Unsilence all, Resolve, Comment, and Delete (which applies to the selected rows only). Silence all appears only when none of the selected alerts is silenced, and Unsilence all only when all of them are; a mixed selection gets neither. Clear selection puts the table back to normal.
Silencing and Resolving Alerts
Use Silence to pause an alert for a chosen duration, and Unsilence to end the silence early. The alert remains available; dashboard status filters control whether it is shown. See Silences and Mute Policies for durations, status indicators, and rules that match multiple alerts.
Use Resolve when the incident is finished. To restore a resolved alert, open the Resolved tab on the Alerts page, select the alert, and choose Unresolve in its details panel. This returns it to the active list with Firing status. See Archived Alerts for more about reviewing resolved alerts.
Next steps
- Adding Alerts — how alerts get into OpsiMate
- Silences and Mute Policies — pausing noise on purpose
- Actions — what OpsiMate can do about an alert
- Archived Alerts — reviewing what was resolved